Basketball: das Wichtigste vom 05.09.2026
Mali steht nach 12 Auftritten bei Weltmeisterschaften bei 2 Siegen — der zweite kam gegen Spanien, 82:73. Sika Koné kam auf 19 Punkte und 10 Rebounds. Für Spanien ist das mehr als ein verlorener…

Basketball-Nationalmannschaft
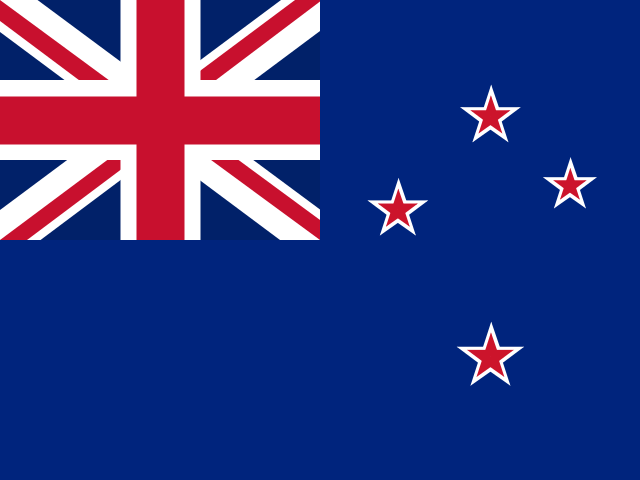 Nationalmannschaft · Neuseeland
«The Breakers»
Drei Geschäftsleute aus der Region Waikato, Michael Redman, Dallas Fisher und Keith Ward, wollten die australische National Basketball League (NBL) nach Neuseeland holen und gründeten dafür einen Verein mit Sitz in Auckland. Zur Saison 2003/04 traten die Breakers als erstes neuseeländisches Team überhaupt in der Liga an, Jeff Green betreute die Mannschaft in ihrer ersten Spielzeit.
Sportlich zahlte sich der Schritt aus, als Auckland zwischen 2011 und 2013 dreimal in Folge den Meistertitel holte, zunächst gegen die Cairns Taipans, danach zweimal gegen die Perth Wildcats. 2015 kam ein vierter Titel dazu, wieder gegen Cairns. Mit Perth verbindet die Breakers seither eine Rivalität, die wegen der Entfernung zwischen den beiden Standorten als "Derby of Distance" bekannt ist; in den Finalserien 2016 und 2023 zog Auckland gegen genau diesen Gegner beziehungsweise gegen die Sydney Kings den Kürzeren. Zuletzt gewannen die Breakers 2026 den neu geschaffenen NBL Ignite Cup, im Endspiel gegen die Adelaide 36ers.
Die Eigentümerstruktur wechselte über die Jahre mehrfach; seit März 2025 gehört der Verein Marc Mitchell.
Kein Spieler hat für die Breakers häufiger aufgelegt als Thomas Abercrombie, der den Verein von der Gründerzeit bis zu seinem Karriereende über Jahre prägte. Seine Rückennummer 10 wird seither nicht mehr vergeben, ein Status, den in Auckland sonst nur wenige Namen wie C. J. Bruton, Paul Henare und Dillon Boucher tragen.
| 14 Oct | NBL |
 Sydney Kings
A
Sydney Kings
A
|
102:101 | S |
| 10 Oct | NBL |
 Perth Wildcats
A
Perth Wildcats
A
|
84:100 | N |
| 4 Oct | NBL |
 Adelaide
A
Adelaide
A
|
88:72 | S |
| 30 Sep | NBL |
 Cairns Taipans
H
Cairns Taipans
H
|
98:75 | S |
| 26 Sep | NBL |
Perth Wildcats
A
|
93:97 | N |
| 22 Sep | NBL |
 Brisbane Bullets
A
Brisbane Bullets
A
|
85:88 | N |
| # | Mannschaft | Sp | S | N | Tore | Pkt. |
|---|---|---|---|---|---|---|
| 5 |
 Melbourne United Melbourne United
|
33 | 20 | 13 | 3041:2905 | 0 |
| 6 |
 Tasmania JackJumpers Tasmania JackJumpers
|
33 | 14 | 19 | 2873:2884 | 0 |
| 7 |
 New Zealand Breakers New Zealand Breakers
|
33 | 13 | 20 | 3022:3058 | 0 |
| 8 |
 Illawarra Hawks Illawarra Hawks
|
33 | 13 | 20 | 3074:3205 | 0 |
| 9 |
Cairns Taipans
|
33 | 9 | 24 | 2754:3194 | 0 |
| Kennzahl | Gesamt | Heim | Auswärts |
|---|---|---|---|
| Spiele | 200 | 97 | 103 |
| Erzielt | 17167 | 8387 | 8780 |
| Kassiert | 17458 | 8377 | 9081 |
| Durchschnitt pro Spiel | 85.8 | 86.5 | 85.2 |
| Gegentore pro Spiel | 87.3 | 86.4 | 88.2 |
| Differenz | −291 | +10 | −301 |
Tasmania JackJumpers
A
NBL
Cairns Taipans
A
NBL
Sydney Kings
A
102:101
S
Perth Wildcats
A
84:100
N
Adelaide
A
88:72
S
Cairns Taipans
H
98:75
S
Perth Wildcats
A
93:97
N
Brisbane Bullets
A
85:88
N
Illawarra Hawks
H
95:81
S
Adelaide
A
111:107
S
Mali steht nach 12 Auftritten bei Weltmeisterschaften bei 2 Siegen — der zweite kam gegen Spanien, 82:73. Sika Koné kam auf 19 Punkte und 10 Rebounds. Für Spanien ist das mehr als ein verlorener…